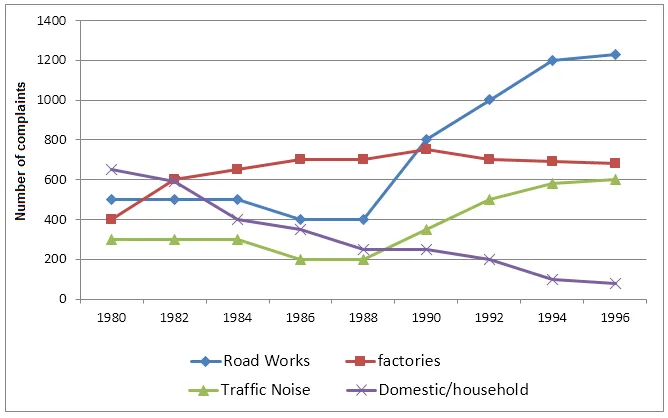
The line graph illustrates the quantity of noise-related grievances lodged with the Environmental Health department in the city of Newtown over a sixteen-year period from 1980 to 1996.
A general overview of the graph reveals a fluctuating trend in the number of noise complaints over the given period. It is also noticeable that there was a significant increase in the number of complaints during the latter half of the period under review.
Looking at the details, the number of noise complaints in 1980 stood at just under 200, which then experienced a steady rise to reach a peak of approximately 600 in 1986. Following this, there was a sharp decline to around 300 complaints in 1988 before a slight recovery in the subsequent year.
From 1989 onwards, the number of complaints rose dramatically, nearly tripling to reach its highest point at around 1800 in 1994. The final two years saw a slight decrease, ending the period at slightly over 1500 complaints in 1996. This indicates a substantial overall increase in noise complaints over the sixteen-year period.


