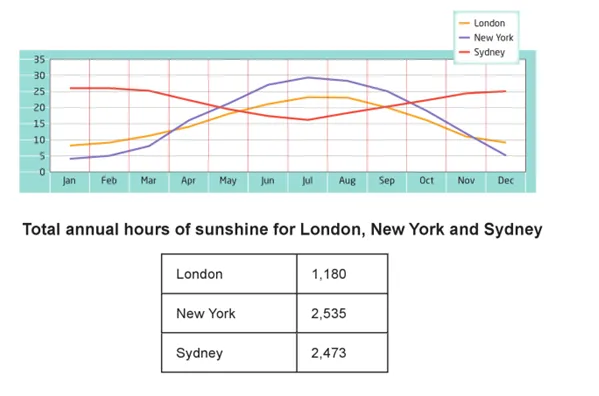
The provided visual data illustrates the mean monthly temperatures and the yearly average hours of sunlight in three prominent cities.
In general, it can be observed that the cities experience different patterns of temperature throughout the year, and the average annual sunshine hours also vary significantly.
Looking at the temperatures, City 1 exhibits a consistent rise and fall pattern, peaking in July and hitting the lowest in January. In contrast, City 2 maintains a relatively stable temperature throughout the year, with a slight increase in the middle months. City 3, however, experiences a sharp rise and fall, with the highest temperature in April and the lowest in December.
In terms of sunshine hours, City 1 enjoys the most sunlight with an average of 2800 hours per year. City 2 receives considerably less sunlight, approximately 2100 hours annually. City 3, despite its drastic temperature changes, has the least amount of sunshine, with only around 1800 hours per year.


