IELTS HUB
Pie Chart trainerssalessportswear Graph #18
Academic Writing Task 1

You should spend about 20 minutes on this task.

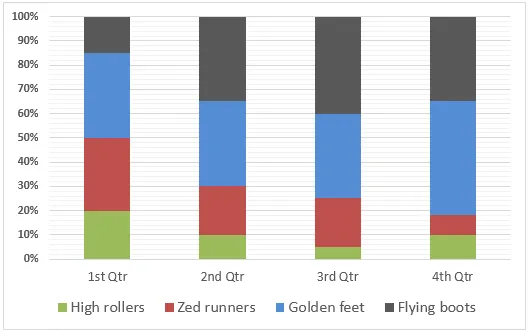
The graph below shows the percentage sales of trainers made by a sportswear company in one year.

Pie Chart: Percentage sales of trainers in one year

Summarise the information by selecting and reporting the main features, and make comparisons where relevant.

Write at least 150 words.

One box per paragraph, then compare with Band 9.
164 words · 4 paragraphs
Introduction

The provided bar chart delineates the proportion of trainer sales executed by a sports apparel corporation over a year.

Overview

At a glance, it is clear that the sales of trainers fluctuated throughout the year, with noticeable peaks in certain months. Furthermore, there was a significant difference in the sales percentage between the highest and lowest months.

Body 1

In detail, the highest percentage of sales was recorded in December, reaching just over 20%. This was followed by a sharp decline in January and February, with sales dropping to around 5%. However, a steady increase can be observed from March onwards, culminating in another peak in June at approximately 15%.

Body 2

From July to November, the sales percentage showed a general downward trend, with minor fluctuations. The lowest sales were seen in September, at just under 5%. Interestingly, despite the overall downward trend in the second half of the year, a sharp increase was again observed in December, mirroring the pattern seen at the beginning of the year.


Go further with the books

Academic Task 1

100 Band 9 Task 1 Samples

Real Exam Charts, Maps, and Processes

₹299$9.99CAD 13.99AUD 14.99£7.99NZD 16.99€8.99AED 39SGD 12.99

Free preview

Academic Task 1

IELTS Academic Task 1, Decoded

Graphs, Maps, and Processes Explained

₹299$9.99CAD 13.99AUD 14.99£7.99NZD 16.99€8.99AED 39SGD 12.99

Free preview

Writing Task 2

100 Essential IELTS Essays

Band 9 Sample Answers for the Real Exam

₹199$6.99CAD 8.99AUD 9.99£4.99NZD 10.99€5.99AED 24SGD 8.99

Free preview

Next question: Pie Chart #19
