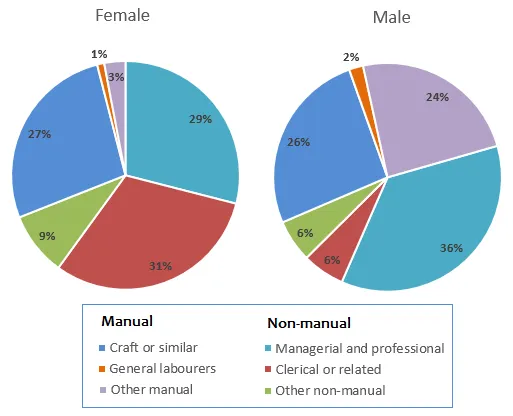
The two pie charts illustrate the distribution of employment across different sectors in Great Britain in the year 1992.
The charts give a broad picture of the employment landscape, highlighting the dominance of the service sector and the relatively minor role played by the agriculture sector. It is also evident that the proportion of male workers was significantly higher in all sectors except for the service industry.
In terms of specific details, the service sector was the largest employer for both genders, accounting for 61% of female and 46% of male employment. This was followed by manufacturing, where 24% of men and 14% of women found jobs. The construction industry was a significant source of employment for men, employing 18% of the male workforce, but it employed only a negligible proportion of women.
On the other hand, the agriculture sector was the least significant, employing a mere 3% of men and an even smaller 1% of women. The finance sector also showed a similar trend, with a slightly higher proportion of men (11%) compared to women (9%). Overall, these figures highlight the gender disparities and sector preferences in Great Britain's employment scenario in 1992.


