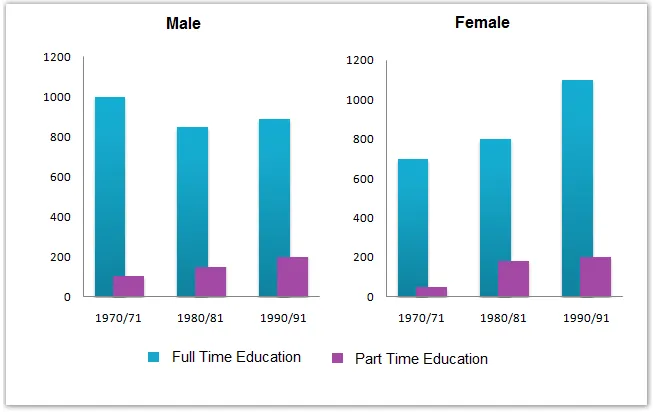
The bar chart illustrates the number of males and females in thousands who were engaged in further education in the UK during three different time intervals, and it also distinguishes between those studying on a full-time basis and those studying part-time.
The most striking feature of the chart is the significant increase in the number of both men and women in further education over the three periods, with women consistently outnumbering men. Furthermore, the majority of students, regardless of gender, were studying part-time rather than full-time.
In the first period, 1970/71, there were approximately 1000 thousand women and 800 thousand men in further education, the majority of whom were part-time students. By 1990/91, the number of women had almost doubled to nearly 2000 thousand, while the number of men had increased to around 1600 thousand. Again, the majority of these students were studying part-time.
By the third period, 2000/01, the number of women had surged to nearly 2800 thousand, while the number of men had risen to approximately 2200 thousand. The trend of more students studying part-time continued, with the number of part-time students far exceeding the number of full-time students for both genders.