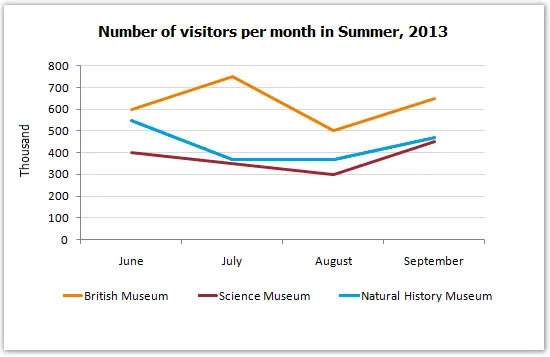
The line graph delineates the fluctuation in the number of visitors to three different museums in London over the four-month period from June to September 2013.
Overall, it is clear that all three museums experienced a rise in visitor numbers, with Museum 1 attracting the most visitors throughout the period. There were, however, variations in the patterns of visitor numbers for each museum.
In June, Museum 1 had the lowest visitor count, but it saw a sharp increase in July, surpassing the other two museums. Despite a slight dip in August, it remained the most visited museum, ending with a peak in September. In contrast, Museums 2 and 3 had a steady rise in visitors, with Museum 2 having a slight edge over Museum 3 in June and July, but falling behind in August and September.
Museum 3, on the other hand, had the most consistent increase in visitors throughout the period. Starting from the highest point in June, it saw a steady rise, albeit slower than the other two museums, and ended up with the second highest visitor count in September.


