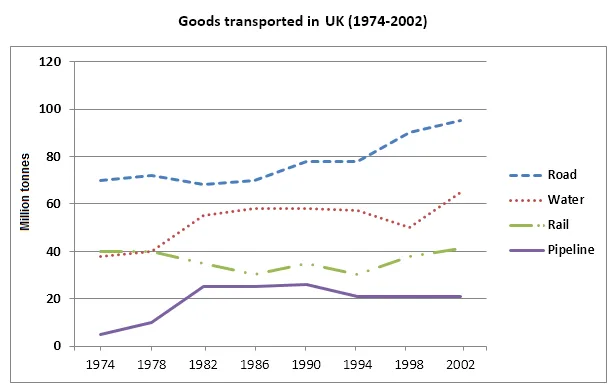
The line graph illustrates the amount of goods conveyed in the UK over a period of 28 years from 1974 to 2002, using four distinct methods of transportation.
The overall trend indicates that road was the most popular mode of transport throughout the period, whereas the use of pipelines remained consistently low. There was a marked increase in the quantity of goods transported by road, while the quantities carried by rail and water fluctuated.
In 1974, approximately 70 million tonnes of goods were transported by road, which saw a steady rise, reaching a peak of about 100 million tonnes in 2002. On the contrary, the quantity of goods transported by rail started at around 40 million tonnes in 1974, dropped to 20 million tonnes in 1978, then increased to 40 million tonnes in 2002.
Regarding the other two modes, water transportation started at 60 million tonnes in 1974, dipped to 40 million tonnes in 1980, and then fluctuated around 60 million tonnes from 1985 onwards. Pipelines, however, consistently transported the least quantity of goods, remaining at about 5 million tonnes throughout the period.


