IELTS HUB
Pie Chart electricityproductionAustralia Graph #206
Academic Writing Task 1

You should spend about 20 minutes on this task.

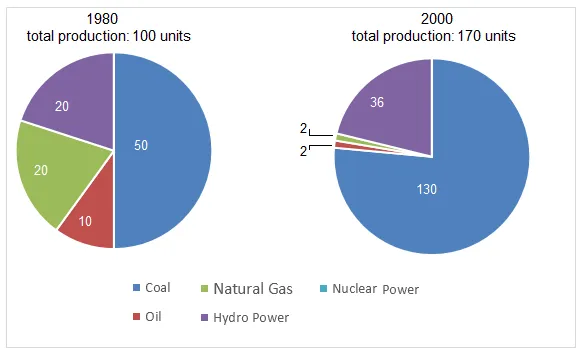
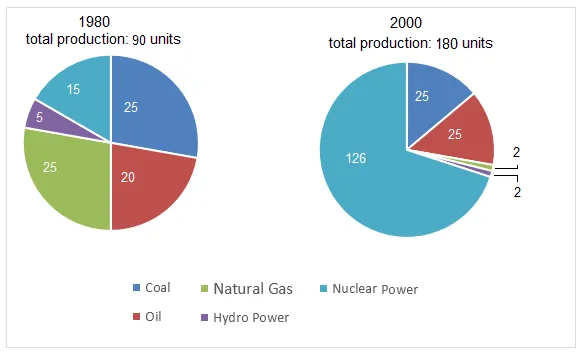
The pie charts below show units of electricity production by fuel source in Australia and France in 1980 and 2000.

Pie Chart: Electricity production in Australia and France 1980-2000 (visual 1 of 2)Pie Chart: Electricity production in Australia and France 1980-2000 (visual 2 of 2)

Summarise the information by selecting and reporting the main features, and make comparisons where relevant.

Write at least 150 words.

One box per paragraph, then compare with Band 9.
198 words · 4 paragraphs
Introduction

The pie charts illustrate the changes in electricity generation in Australia and France, comparing the contribution of different fuel sources in 1980 and 2000.

Overview

In general, both countries saw a shift in their primary source of electricity production over the two decades. While coal was the main source in Australia in 1980, it was replaced by natural gas in 2000. In contrast, France transitioned from relying heavily on oil to nuclear power.

Body 1

In 1980, coal accounted for more than half of Australia's electricity production, at 50.5%, but this figure dropped significantly to 19.5% in 2000. Meanwhile, the contribution of natural gas surged from 19.5% to 35.5%. In France, the use of oil for electricity generation plunged from 39.5% to a mere 3.5%, while nuclear power's share ballooned from 25% to a staggering 76%.

Body 2

The shifts in fuel sources for electricity production in both countries reflect changes in energy policies and technological advancements over the 20-year period. These changes have led to a reduction in the use of traditional fuels like coal and oil, and an increase in the use of cleaner or more efficient sources such as natural gas and nuclear power.


Go further with the books

Academic Task 1

100 Band 9 Task 1 Samples

Real Exam Charts, Maps, and Processes

₹299$9.99CAD 13.99AUD 14.99£7.99NZD 16.99€8.99AED 39SGD 12.99

Free preview

Academic Task 1

IELTS Academic Task 1, Decoded

Graphs, Maps, and Processes Explained

₹299$9.99CAD 13.99AUD 14.99£7.99NZD 16.99€8.99AED 39SGD 12.99

Free preview

Vocabulary

Upgrade Your English

1,800 Sentences from Band 5 to Band 9

₹299$9.99CAD 13.99AUD 14.99£7.99NZD 16.99€8.99AED 39SGD 12.99

Free preview

Next question: Line Graph #207
