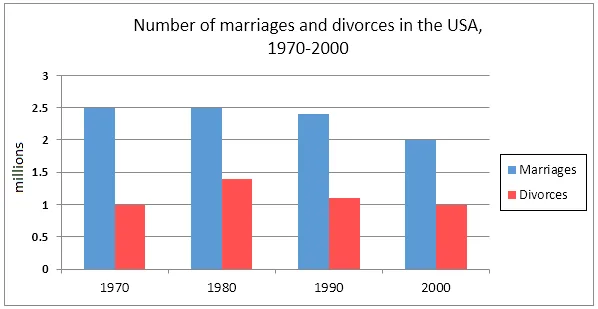
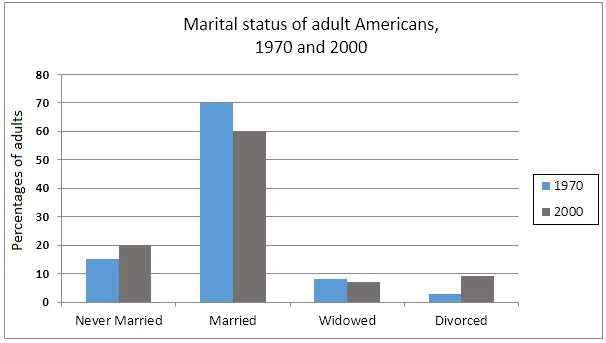
The charts illustrate the changes in marriage and divorce rates in the USA from 1970 to 2000 and the marital status of the population in 1970 and 2000.
The overall trend indicates a decrease in marriage rates and an increase in divorce rates over the 30-year period. Additionally, the proportion of married adults reduced significantly while the percentage of adults who had never been married or were divorced increased.
In 1970, the marriage rate stood at 2.5 per 1000, which then fell gradually to just over 2.0 in 2000. The divorce rate, on the other hand, rose from 1.0 per 1000 in 1970 to 1.5 in 1980, before falling slightly to just under 1.5 in 2000.
Regarding the marital status of adults, the proportion of married individuals declined from 70% in 1970 to around 60% in 2000. Conversely, the percentage of adults who had never married rose from 15% to approximately 20%, and the proportion of divorced adults doubled from 5% to 10% over the same period.


