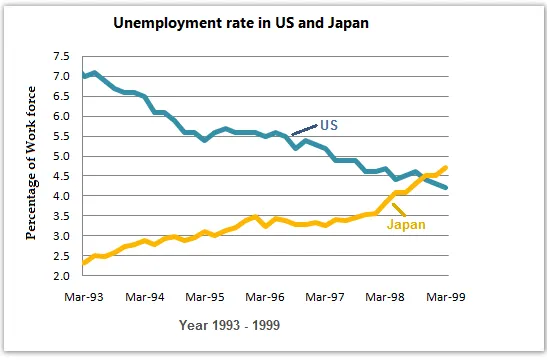
The line graph compares the percentage of jobless people in the US and Japan over a six-year period starting from March 1993 and ending in March 1999.
The most noticeable trend in the graph is that unemployment rates in both countries fluctuated during this period, with Japan experiencing a steady increase in unemployment while the US saw a gradual decline. Additionally, it is evident that the US consistently had a higher unemployment rate than Japan, despite the latter's upward trend.
In March 1993, the percentage of unemployed people in the US was slightly over 7%, which gradually decreased to just under 5% by March 1999. There were minor increases in 1994 and 1995, but the overall trend was a decline. In contrast, Japan started with an unemployment rate of just over 2.5% in 1993, which rose steadily to reach a peak of 4.5% by the end of the period.
In conclusion, while both countries experienced fluctuations in unemployment rates, the US saw a decrease over the six-year period, whereas Japan witnessed a consistent rise. Despite these trends, the unemployment rate in the US remained higher than in Japan throughout the period under review.


