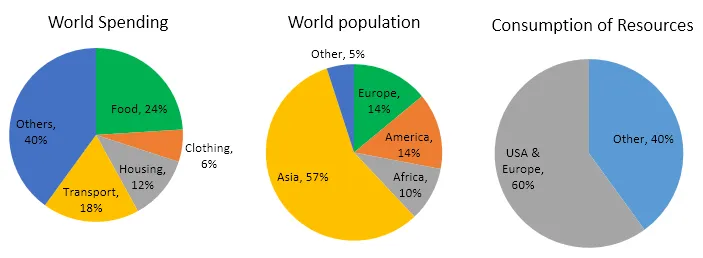
The pie diagrams provided illustrate the global distribution of population, resource consumption, and expenditure.
At a glance, it is evident that there is a stark contrast between the distribution of the world's population and the consumption of resources or spending. While some regions have a high population but consume fewer resources and spend less, others with a smaller population have a higher rate of resource consumption and expenditure.
Delving into the details, Asia, with over half of the world's population, accounts for only about a quarter of global resource consumption and spending. In contrast, North America, with a mere 5% of the global population, is responsible for a staggering 24% of resource consumption and 31% of spending. Europe, with 12% of the world's population, also shows a similar trend, consuming 23% of resources and accounting for 29% of spending.
In conclusion, the data clearly demonstrates a significant imbalance in the distribution of resource consumption and spending in relation to the population. This disparity is most evident between Asia and regions like North America and Europe, highlighting the need for more equitable resource management and spending practices worldwide.


