IELTS HUB
Bar Graph educationenrollmentcolleges Graph #228
Academic Writing Task 1

You should spend about 20 minutes on this task.

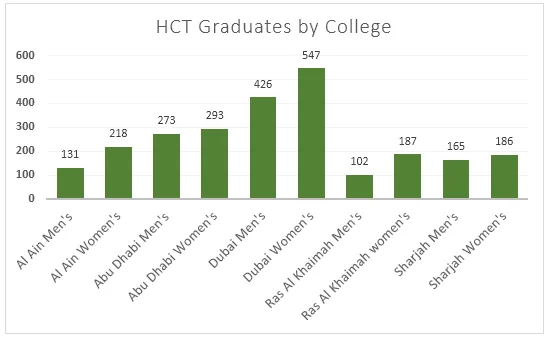
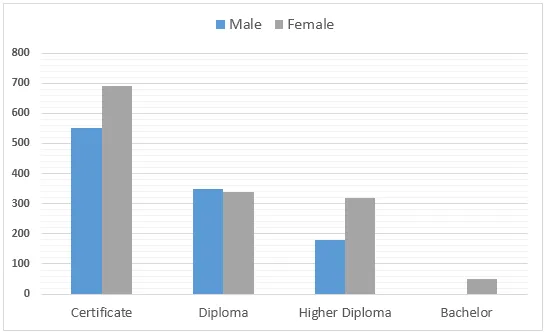
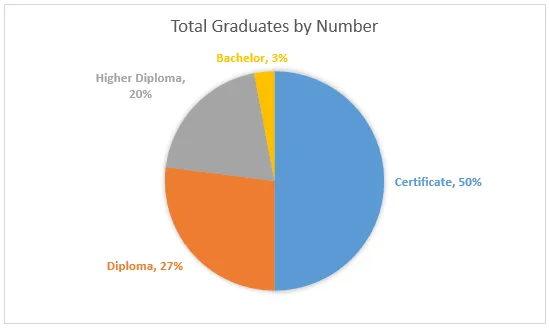
The graphs show enrolment in different colleges in the Higher Colleges of Technology in 1999.

Bar Graph: Higher Colleges of Technology enrollment 1999 (visual 1 of 3)Bar Graph: Higher Colleges of Technology enrollment 1999 (visual 2 of 3)Bar Graph: Higher Colleges of Technology enrollment 1999 (visual 3 of 3)

Summarise the information by selecting and reporting the main features, and make comparisons where relevant.

Write at least 150 words.

One box per paragraph, then compare with Band 9.
164 words · 4 paragraphs
Introduction

The given diagrams illustrate the number of students enrolled in various colleges under the Higher Colleges of Technology in the year 1999.

Overview

In general, it can be seen that the student intake was significantly higher in certain colleges compared to others. Furthermore, there was a noticeable difference in the gender distribution across the colleges.

Body 1

Delving into the details, the Business college had the highest enrolment with over 2000 students, followed by the Information Systems college with just under 2000 students. Both these colleges had a higher number of female students compared to males. In contrast, the Engineering college had a higher number of male students, with the total enrolment being around 1000.

Body 2

The remaining colleges, namely Applied Communications, Health Sciences, and Education, had relatively lower enrolments, with the figures ranging from approximately 500 to 1000 students. Interestingly, the Education and Health Sciences colleges had a predominantly female student population, whereas the Applied Communications college had a roughly equal distribution of male and female students.


How our answers are made

Go further with the books

Academic Task 1

100 Band 9 Task 1 Samples

Real Exam Charts, Maps, and Processes

₹299$9.99CAD 13.99AUD 14.99£7.99NZD 16.99€8.99AED 39SGD 12.99

Free preview

Academic Task 1

IELTS Academic Task 1, Decoded

Graphs, Maps, and Processes Explained

₹299$9.99CAD 13.99AUD 14.99£7.99NZD 16.99€8.99AED 39SGD 12.99

Free preview

Vocabulary

Upgrade Your English

1,800 Sentences from Band 5 to Band 9

₹299$9.99CAD 13.99AUD 14.99£7.99NZD 16.99€8.99AED 39SGD 12.99

Free preview

Next question: Line Graph #229
