IELTS HUB
Line Graph entertainmentcinemaattendance Graph #229
Academic Writing Task 1

You should spend about 20 minutes on this task.

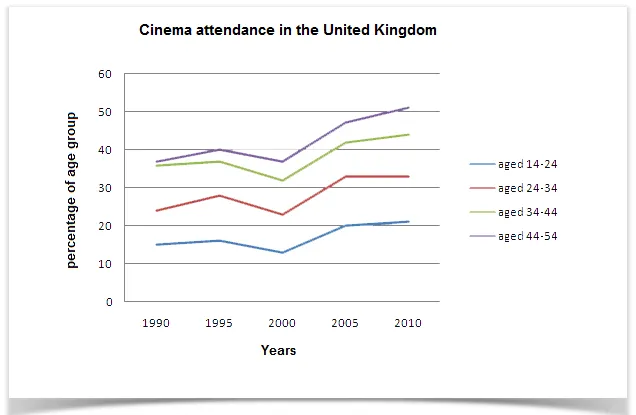
The line graph below gives information on cinema attendance in the UK.

Line Graph: UK cinema attendance over time

Summarise the information by selecting and reporting the main features, and make comparisons where relevant.

Write at least 150 words.

One box per paragraph, then compare with Band 9.
166 words · 4 paragraphs
Introduction

The line graph illustrates the trends in cinema visitation in the United Kingdom over a span of 52 years, from 1946 to 1998.

Overview

Overall, it is clear that the number of people attending cinemas in the UK experienced a significant decline from 1946 to 1984, followed by a gradual recovery until 1998. The most striking feature is the dramatic drop in cinema attendance during the first 30 years shown.

Body 1

In 1946, the number of cinema-goers was at its peak, with over 1600 million people attending. However, this figure plummeted rapidly to just above 200 million in 1984, marking a decrease of nearly 1400 million over this period. This suggests a major shift in entertainment preferences or availability during these years.

Body 2

From 1984 onwards, there was a steady increase in cinema attendance, although the numbers never reached the highs of the 1940s. By 1998, the number of cinema-goers had risen to approximately 140 million, indicating a resurgence in the popularity of cinema as a form of entertainment.


Go further with the books

Academic Task 1

100 Band 9 Task 1 Samples

Real Exam Charts, Maps, and Processes

₹299$9.99CAD 13.99AUD 14.99£7.99NZD 16.99€8.99AED 39SGD 12.99

Free preview

Academic Task 1

IELTS Academic Task 1, Decoded

Graphs, Maps, and Processes Explained

₹299$9.99CAD 13.99AUD 14.99£7.99NZD 16.99€8.99AED 39SGD 12.99

Free preview

Vocabulary

Upgrade Your English

1,800 Sentences from Band 5 to Band 9

₹299$9.99CAD 13.99AUD 14.99£7.99NZD 16.99€8.99AED 39SGD 12.99

Free preview

Next question: Line Graph #230
