IELTS HUB
Line Graph salesentertainmentgames Graph #230
Academic Writing Task 1

You should spend about 20 minutes on this task.

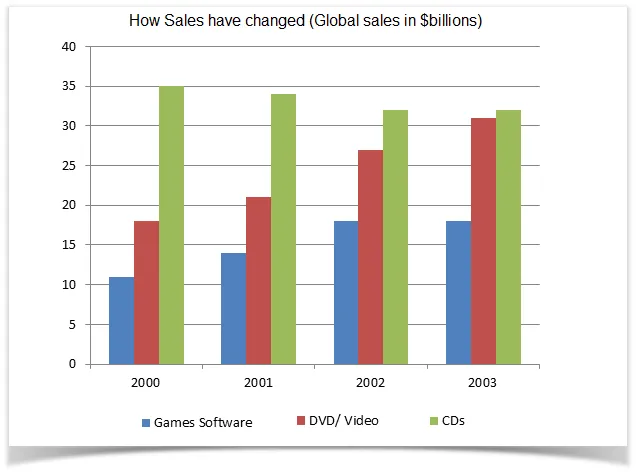
The chart below gives information about global sales of games software, CDs and DVD or video.

Line Graph: Global sales of games, CDs, DVDs and videos

Summarise the information by selecting and reporting the main features, and make comparisons where relevant.

Write at least 150 words.

One box per paragraph, then compare with Band 9.
165 words · 4 paragraphs
Introduction

The bar chart illustrates the worldwide sales figures for games software, CDs and DVD or video between 2000 and 2003.

Overview

At a glance, it is clear that sales for all three items experienced an upward trend over the four-year period. However, the rate of increase varied, with games software seeing the most significant growth.

Body 1

In 2000, games software sales stood at approximately $20 billion, a figure that rose steadily to reach around $35 billion in 2003. This marked an increase of $15 billion, the highest among the three categories. CDs, on the other hand, started at just under $30 billion in 2000, and despite a slight dip in 2002, ended at roughly the same level in 2003.

Body 2

Sales of DVDs or videos started at around $18 billion in 2000, and saw a consistent rise over the years, reaching about $29 billion in 2003. This category, although starting at the lowest point, demonstrated a steady growth rate, surpassing the sales of CDs in the final year.


Go further with the books

Academic Task 1

100 Band 9 Task 1 Samples

Real Exam Charts, Maps, and Processes

₹299$9.99CAD 13.99AUD 14.99£7.99NZD 16.99€8.99AED 39SGD 12.99

Free preview

Academic Task 1

IELTS Academic Task 1, Decoded

Graphs, Maps, and Processes Explained

₹299$9.99CAD 13.99AUD 14.99£7.99NZD 16.99€8.99AED 39SGD 12.99

Free preview

Vocabulary

Upgrade Your English

1,800 Sentences from Band 5 to Band 9

₹299$9.99CAD 13.99AUD 14.99£7.99NZD 16.99€8.99AED 39SGD 12.99

Free preview

Next question: Pie Chart #231
