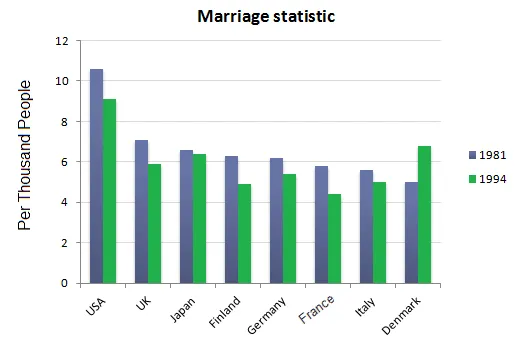
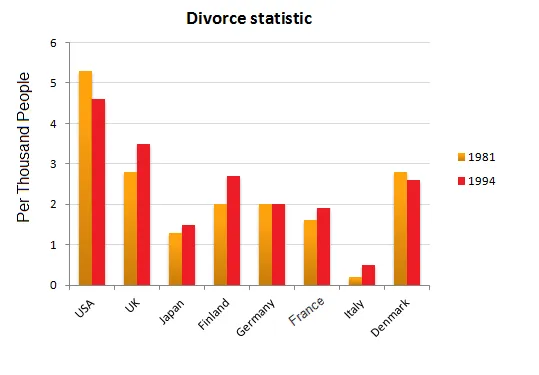
The bar graphs provide information about the number of marriages and divorces in eight different nations in the years 1981 and 1994.
The overall trend observed from the charts is that the majority of the countries experienced a decline in the number of marriages and an increase in divorces over the 13-year period. However, there were some exceptions to this pattern.
In 1981, the USA had the highest number of marriages, which was significantly higher than in other countries. However, by 1994, the number of marriages had dropped dramatically. In contrast, the UK saw a slight increase in marriages over the same period. Interestingly, the number of divorces in the USA was also the highest in both years, while in the UK, the number of divorces increased significantly from 1981 to 1994.
In the other countries, the number of marriages generally decreased, with the exception of Denmark, where it remained stable. The number of divorces, on the other hand, increased in all countries except for Denmark and Norway, where it remained unchanged. In particular, the number of divorces in Spain and France saw a substantial rise over the 13-year period.


