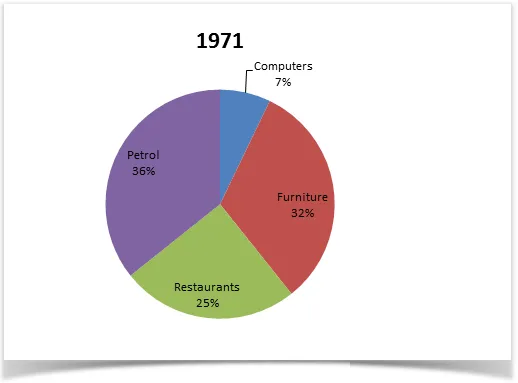
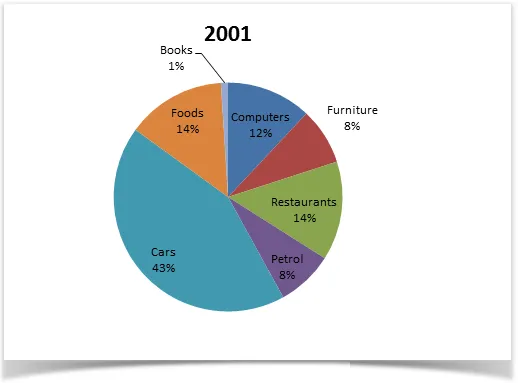
The given diagrams illustrate the alterations in expenditure patterns of UK residents over a thirty-year period from 1971 to 2001.
A general overview of the graphs reveals that spending on cars experienced a significant rise, while expenditure on food saw a considerable decline. In contrast, the other categories remained relatively stable throughout the period.
In 1971, the highest proportion of spending was on food, accounting for over 20% of the total. However, by 2001, this figure had dropped to just under 15%. Simultaneously, spending on cars, which was initially just over 10%, had risen to approximately 23% by the end of the period, making it the largest area of expenditure in 2001.
In terms of the other categories, expenditure on computers remained relatively low, at around 2% in 2001, up from virtually nothing in 1971. Spending on restaurants and books remained fairly stable, with a slight increase in the former and a marginal decrease in the latter. Overall, the data indicates a shift in spending from essential items such as food to discretionary items like cars over the thirty-year period.


