IELTS HUB
Table transportationtravel modesEngland Graph #244
Academic Writing Task 1

You should spend about 20 minutes on this task.

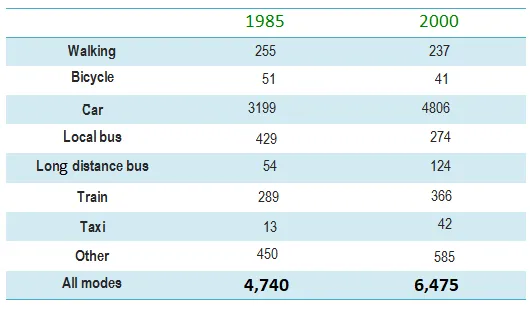
The table below gives information about changes in modes of travel in England between 1985 and 2000.

Table: Travel modes changes in England 1985-2000

Summarise the information by selecting and reporting the main features, and make comparisons where relevant.

Write at least 150 words.

One box per paragraph, then compare with Band 9.
178 words · 4 paragraphs
Introduction

The table provides data on how travel methods in England evolved over the period from 1985 to 2000.

Overview

A general observation of the table reveals that car was the most popular mode of transport throughout the given period, while the use of other methods fluctuated. Additionally, the total miles travelled by all methods saw a significant increase.

Body 1

In more detail, the number of miles travelled by car dramatically rose from 3,199 in 1985 to 4,806 in 2000, an increase of over 50%. During the same period, the use of local bus also saw a slight increase from 429 to 458 miles. However, the miles travelled by walking experienced a sharp decrease from 255 to 192 miles.

Body 2

On the other hand, the distance covered by other modes of transport, such as bicycle and taxi, remained relatively stable. The bicycle usage slightly dropped from 51 to 41 miles, while taxi usage saw a marginal increase from 13 to 42 miles. Overall, the total miles travelled by all methods combined went up from 4,740 to 6,475 miles.


Go further with the books

Academic Task 1

100 Band 9 Task 1 Samples

Real Exam Charts, Maps, and Processes

₹299$9.99CAD 13.99AUD 14.99£7.99NZD 16.99€8.99AED 39SGD 12.99

Free preview

Academic Task 1

IELTS Academic Task 1, Decoded

Graphs, Maps, and Processes Explained

₹299$9.99CAD 13.99AUD 14.99£7.99NZD 16.99€8.99AED 39SGD 12.99

Free preview

Writing Task 2

100 Essential IELTS Essays

Band 9 Sample Answers for the Real Exam

₹199$6.99CAD 8.99AUD 9.99£4.99NZD 10.99€5.99AED 24SGD 8.99

Free preview

Next question: Bar Graph #245
