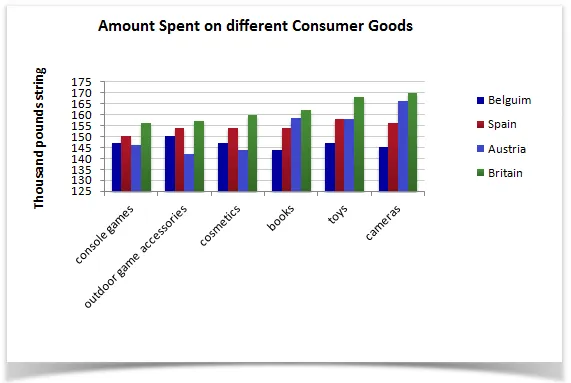
The bar chart illustrates the expenditure on consumer goods in four different countries in the year 2012.
At a glance, it is clear that the spending habits varied significantly among the countries, with the highest expenditure seen in the UK and the lowest in India. Furthermore, the spending pattern in each country differed across the various categories of goods.
Looking more closely, the UK had the highest expenditure in all categories, with the most spending seen on personal care items, followed closely by leisure and education. The least amount was spent on clothing. In contrast, India had the lowest overall spending, with the majority of its expenditure going towards food.
In the case of the USA and Japan, the expenditure was fairly balanced across all categories. However, the USA spent slightly more on personal care items, while Japan allocated more of its spending to food. Interestingly, both countries spent the least on clothing, similar to the trend observed in the UK.


