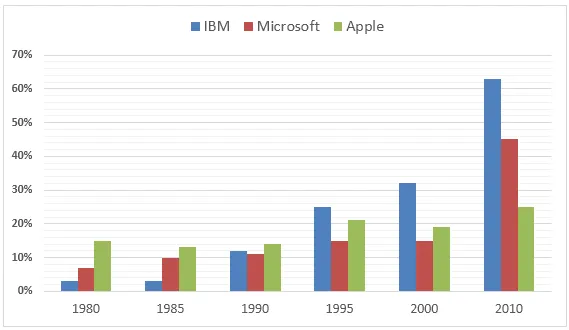
The bar graph illustrates the proportion of males involved in high-level management in three different firms from 1980 to 2010.
In general, all three companies experienced fluctuations in the percentage of men in senior roles over the three-decade period. However, it is noticeable that Company A saw a significant decline, while Company B and C showed an overall increase in male participation at the senior level.
In 1980, Company A had the highest percentage of men in senior positions, at around 80%, but this figure dropped dramatically to just over 20% by 2010. In contrast, Company B, which had the lowest percentage in 1980 at approximately 30%, witnessed a steady rise to reach nearly 70% in 2010.
Similarly, Company C also saw an upward trend in the male participation in senior roles, increasing from around 50% in 1980 to roughly 60% in 2010. However, this growth was not as pronounced as that of Company B. In conclusion, while the male participation in senior roles decreased in Company A, it increased in Companies B and C during the 30-year period.


