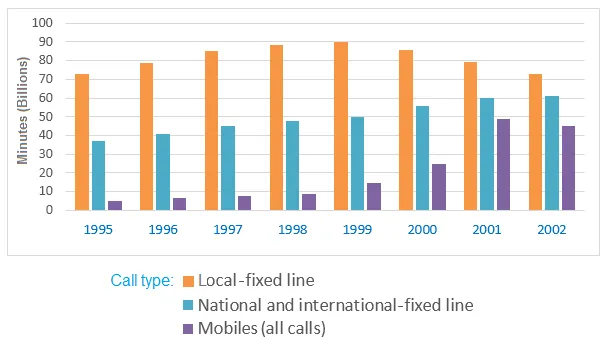
The bar chart provides information about the total duration of phone calls, measured in billions of minutes, in the United Kingdom from 1995 to 2002. The calls are categorized into three types: local, national and international, and mobile.
The most striking feature from the chart is the significant increase in mobile phone usage over the period, while the other two categories show a contrasting trend. It is also noticeable that local calls were the most popular type of calls at the beginning of the period.
In 1995, local calls dominated the chart with 72 billion minutes, while national and international calls were just over 40 billion minutes. Mobile calls, on the other hand, were significantly lower at about 3 billion minutes. However, by 2002, although local and national/international calls had decreased to around 60 and 38 billion minutes respectively, mobile calls had skyrocketed to nearly 45 billion minutes.
In conclusion, while traditional landline calls, both local and national/international, saw a decline in the UK between 1995 and 2002, the use of mobile phones for calling purposes experienced a dramatic growth during the same period.


