IELTS HUB
Line Graph smokinghealthtrends Graph #261
Academic Writing Task 1

You should spend about 20 minutes on this task.

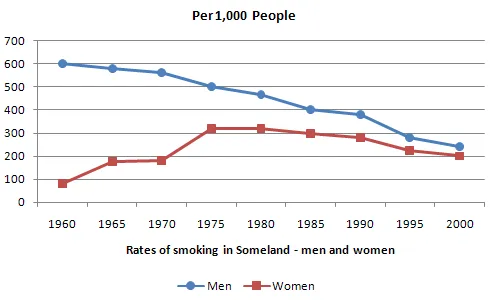
The graph below shows the rate of smoking per 1000 people in Someland from 1960 to 2000.

Line Graph: Smoking rate in Someland from 1960-2000

Summarise the information by selecting and reporting the main features, and make comparisons where relevant.

Write at least 150 words.

One box per paragraph, then compare with Band 9.
164 words · 4 paragraphs
Introduction

The line graph delineates the frequency of smokers in Someland per thousand individuals over a period of forty years from 1960 to 2000.

Overview

From a broad perspective, it can be seen that the smoking rate experienced a significant fluctuation over the time period. While the rate of male smokers showed a general decline, the trend for females was somewhat different, with an initial increase followed by a decrease.

Body 1

In 1960, the rate of male smokers was high at approximately 600 per 1000, which then saw a gradual fall until 2000, ending at just under 200. In contrast, the rate of female smokers in 1960 was considerably lower at around 100, but this figure rose sharply to peak at nearly 350 in 1975.

Body 2

Following this peak, the rate of female smokers began to decline, reaching around 200 per 1000 by the year 2000. Hence, by the end of the century, the rates of smoking for both genders in Someland had converged to a similar level.


Go further with the books

Academic Task 1

100 Band 9 Task 1 Samples

Real Exam Charts, Maps, and Processes

₹299$9.99CAD 13.99AUD 14.99£7.99NZD 16.99€8.99AED 39SGD 12.99

Free preview

Academic Task 1

IELTS Academic Task 1, Decoded

Graphs, Maps, and Processes Explained

₹299$9.99CAD 13.99AUD 14.99£7.99NZD 16.99€8.99AED 39SGD 12.99

Free preview

Vocabulary

Upgrade Your English

1,800 Sentences from Band 5 to Band 9

₹299$9.99CAD 13.99AUD 14.99£7.99NZD 16.99€8.99AED 39SGD 12.99

Free preview

Next question: Pie Chart #262
