IELTS HUB
Line Graph gold salesDubaieconomy Graph #278
Academic Writing Task 1

You should spend about 20 minutes on this task.

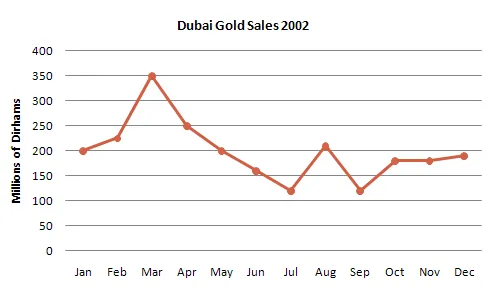
The line graph shows estimated sales of gold in Dubai for 12 months in 2002 in millions of Dirhams.

Line Graph: Estimated gold sales in Dubai for 2002

Summarise the information by selecting and reporting the main features, and make comparisons where relevant.

Write at least 150 words.

One box per paragraph, then compare with Band 9.
167 words · 4 paragraphs
Introduction

The line graph provides information about the projected sales of gold in Dubai over a period of one year in 2002, with the figures given in millions of Dirhams.

Overview

The graph generally depicts a fluctuating trend in gold sales throughout the year, with noticeable peaks and troughs. It is clear that the sales were not consistent and varied greatly from month to month.

Body 1

In the first quarter of the year, sales started at around 200 million Dirhams in January, then experienced a significant decline to approximately 120 million Dirhams in February. However, this downward trend was short-lived as sales surged dramatically to reach a peak at nearly 350 million Dirhams in March.

Body 2

Following this, there was a steady decline in sales until July when it reached its lowest point at just over 100 million Dirhams. The latter half of the year saw a gradual increase in sales, with a sharp rise in October and December, culminating in the year's second highest peak of about 300 million Dirhams.


How our answers are made

Go further with the books

Academic Task 1

100 Band 9 Task 1 Samples

Real Exam Charts, Maps, and Processes

₹299$9.99CAD 13.99AUD 14.99£7.99NZD 16.99€8.99AED 39SGD 12.99

Free preview

Academic Task 1

IELTS Academic Task 1, Decoded

Graphs, Maps, and Processes Explained

₹299$9.99CAD 13.99AUD 14.99£7.99NZD 16.99€8.99AED 39SGD 12.99

Free preview

Writing Task 2

100 Essential IELTS Essays

Band 9 Sample Answers for the Real Exam

₹199$6.99CAD 8.99AUD 9.99£4.99NZD 10.99€5.99AED 24SGD 8.99

Free preview

Next question: Bar Graph #279
