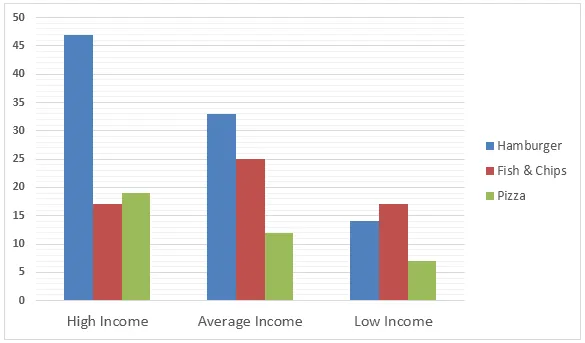
The bar chart provides information about the amount of money spent on different types of fast food by various income groups in the UK.
At a glance, it is clear that high-income earners spend the most on fast food, with hamburgers being their preferred choice. In contrast, low-income groups spend the least overall, but have a relatively high expenditure on fish and chips.
Looking in more detail, high-income consumers spend over 80 million pounds on hamburgers, which is significantly more than any other income group or food item. They also spend around 50 million pounds on pizza and roughly 35 million pounds on fish and chips.
In contrast, the low-income group spends just over 20 million pounds on hamburgers, which is their highest expenditure, followed by about 15 million pounds on fish and chips. Their spending on pizza is the lowest, at just under 10 million pounds. Interestingly, the middle-income group's expenditure pattern is similar to that of the high-income group, although the total amounts spent are considerably lower.


