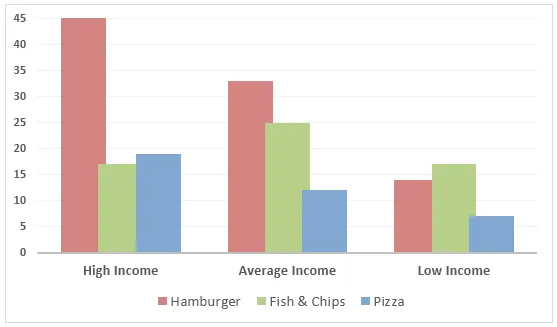
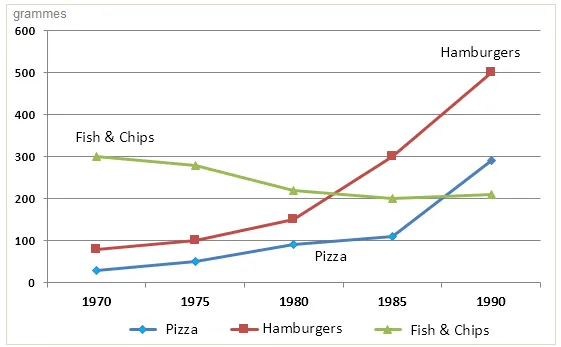
The bar chart presents the weekly expenditure on different types of fast food in the UK, while the line graph illustrates the changes in the frequency of consumption of these foods over a 20-year period.
At a glance, the bar chart reveals that hamburgers were the most expensive fast food, and fish and chips were the least costly. The line graph, on the other hand, indicates a general increase in the consumption of pizza and hamburgers over the two decades, while the consumption of fish and chips saw a decline.
More specifically, the weekly expenditure on hamburgers was around £45, which was significantly higher than the roughly £25 spent on pizzas and £15 on fish and chips. In terms of consumption trends, the frequency of eating hamburgers and pizzas saw a steady rise from 1970 to 1990. The former started at just below 10 times per year and ended at approximately 100 times, while the latter increased from about 10 to 50 times per year.
Conversely, the consumption of fish and chips showed a downward trend over the same period. Starting at nearly 100 times per year in 1970, it had dropped to around 40 times by 1990. This indicates a shift in the British preference for fast food over this 20-year period.


