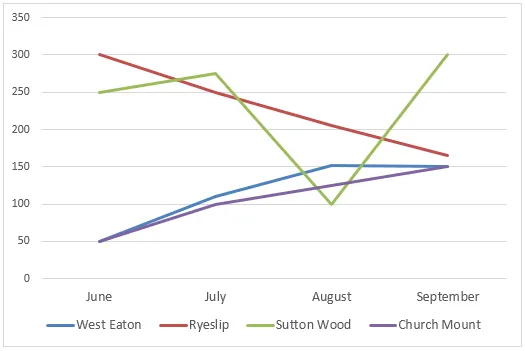
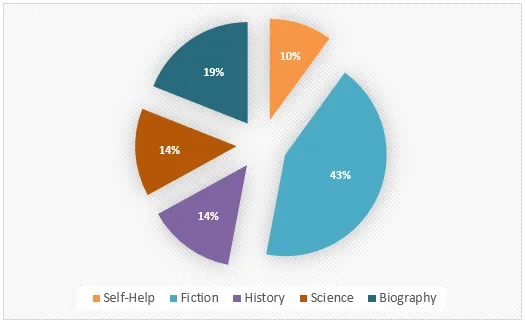
The line graph presents the quantity of books loaned from four rural libraries during four distinct months in 2014, whereas the pie chart illustrates the proportion of borrowed books, classified by genre, throughout the same period.
The line graph reveals a fluctuating trend in the number of books borrowed, with all four libraries experiencing both increases and decreases at different times. The pie chart, on the other hand, shows that novels were the most popular type of book borrowed, while reference books were the least popular.
In January, the number of books borrowed from all four libraries was relatively similar, ranging from 200 to 300. However, by April, Library 1 had seen a significant increase in borrowings to 600, while the other three libraries had experienced a decline. In July, Library 2's borrowings surpassed those of Library 1, reaching a peak of 700, while Library 1's borrowings dropped to 400. By October, Library 1's borrowings had rebounded to 700, while Library 2's had declined to 500.
As for the pie chart, it shows that novels accounted for the majority of borrowed books at 45%, followed by science books at 30%. History books made up 20% of the borrowings, while reference books were the least borrowed, making up just 5% of the total.


