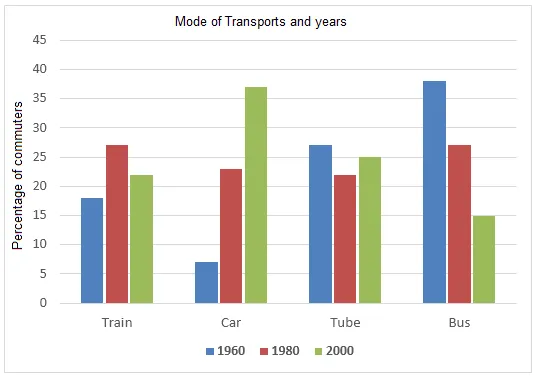
The line graph illustrates the various means of transportation employed by individuals commuting to their workplaces in a particular European city during the years 1960, 1980 and 2000.
In general, it can be observed that the use of cars for commuting witnessed a significant increase over the period, while the popularity of buses experienced a substantial decline. The usage of bikes and trains, on the other hand, remained relatively stable throughout the years.
In 1960, buses were the most popular mode of transport, used by approximately 40% of commuters, while only about 20% used cars. However, by 1980, the use of cars had surged to nearly 35%, overtaking buses which had dropped to around 27%. The trend continued into 2000, with over half of the commuters opting for cars, and the use of buses falling to just under 15%.
In contrast, the use of bikes and trains remained relatively steady over the 40-year period. Bikes were used by around 23% of commuters in 1960, and this figure fluctuated slightly, ending at about 20% in 2000. Similarly, train usage hovered around 15% throughout the years, indicating a consistent preference for these modes of transport despite the changing trends in car and bus usage.


