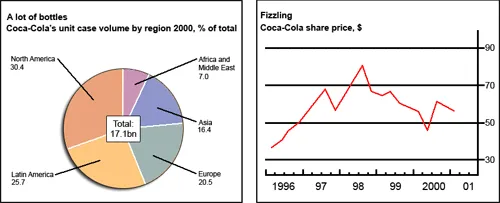
The given diagram and chart depict the fluctuation in sales and stock prices for the Coca-Cola company over a ten-year period.
At a broad level, it can be observed that the sales and share prices of Coca-Cola have shown both growth and decline during the given period. Interestingly, the trends in sales and share prices do not always correspond to each other.
Looking at the sales first, there was a steady increase from 2000 to 2004, reaching a peak in 2004. However, the sales then dropped drastically in 2005, before recovering and fluctuating between 2006 and 2010. On the other hand, the share prices showed a different pattern. Starting from a low point in 2000, they climbed sharply till 2002, then fell and remained relatively stable till 2005. Post 2005, the share prices showed a consistent rise, peaking in 2007, and then experienced a sharp decline in 2008, before stabilizing again in the remaining years.
In conclusion, while there were periods of growth and decline in both sales and share prices, the two did not always mirror each other, indicating that other factors may have influenced the share prices of Coca-Cola.


