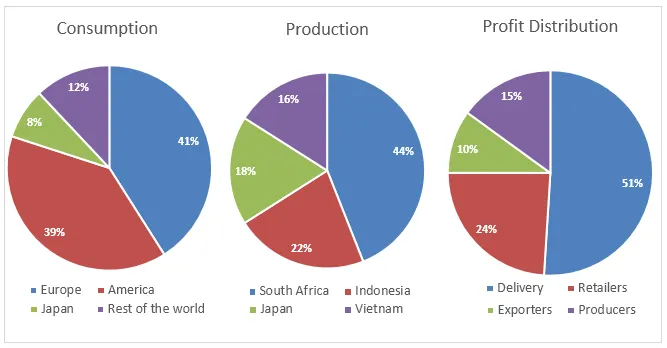
The pie diagrams illustrate the global production and consumption of coffee as well as the distribution of profits from this industry.
At a glance, it is evident that the production and consumption of coffee are not evenly spread across the world, and the profit distribution is also quite disproportionate. The majority of coffee is produced in South America, yet the largest consumers are in North America and Europe, which also reap most of the industry's profits.
In terms of production, South America is the leading producer, accounting for more than half of the world's coffee. Africa and Asia, despite being significant producers, contribute less to the global output. On the other hand, North America and Europe are the primary consumers, with North America alone consuming almost half of the world's coffee. Asia and Africa have relatively low consumption rates.
Regarding profit distribution, it is striking that North America and Europe, which are not major producers, enjoy the lion's share of the profits. North America, in particular, garners nearly half of the total profits, while Europe collects a third. South America, despite being the largest producer, receives a small fraction of the profits, highlighting a significant imbalance in the global coffee industry.


