IELTS HUB
Bar Graph waterconsumptionAmericans Graph #30
Academic Writing Task 1

You should spend about 20 minutes on this task.

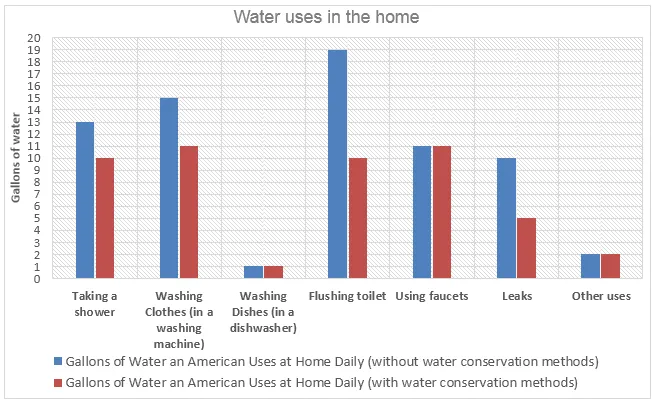
The graph below shows the daily water consumption for Americans in their homes.

Bar Graph: Daily water consumption for Americans at home

Summarise the information by selecting and reporting the main features, and make comparisons where relevant.

Write at least 150 words.

One box per paragraph, then compare with Band 9.
168 words · 4 paragraphs
Introduction

The line chart illustrates the average volume of water utilised by individuals in America in their residences on a daily basis.

Overview

At a glance, it is clear that the water consumption fluctuates throughout the day, with two prominent peaks and a noticeable trough. The consumption is relatively low in the early hours, increases during the day, and drops again during the night.

Body 1

In the early morning, around 5 am, the water usage is at its lowest, roughly 5 gallons per person. However, it rises sharply to reach a peak of approximately 45 gallons at 7 am, presumably due to morning routines. Afterward, the consumption decreases gradually until midday, where it plateaus at around 20 gallons for a few hours.

Body 2

In the afternoon, the water usage starts to climb again, reaching the second peak of about 40 gallons at 7 pm. This could be attributed to activities such as cooking and bathing. Following this, the consumption decreases steadily throughout the night, returning to the lowest level by 5 am.


How our answers are made

Go further with the books

Academic Task 1

100 Band 9 Task 1 Samples

Real Exam Charts, Maps, and Processes

₹299$9.99CAD 13.99AUD 14.99£7.99NZD 16.99€8.99AED 39SGD 12.99

Free preview

Academic Task 1

IELTS Academic Task 1, Decoded

Graphs, Maps, and Processes Explained

₹299$9.99CAD 13.99AUD 14.99£7.99NZD 16.99€8.99AED 39SGD 12.99

Free preview

Vocabulary

Upgrade Your English

1,800 Sentences from Band 5 to Band 9

₹299$9.99CAD 13.99AUD 14.99£7.99NZD 16.99€8.99AED 39SGD 12.99

Free preview

Next question: Line Graph #31
