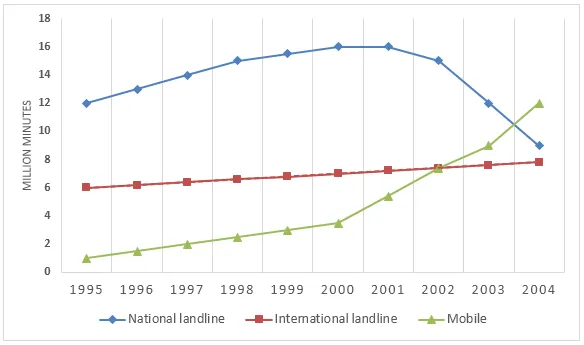
The bar chart illustrates the total duration of phone calls, measured in million minutes, in Denmark over a decade from 1995 to 2004, which is split into three distinct categories.
A general observation of the chart reveals that local fixed line calls were the most popular type of call at the beginning of the period, but their popularity declined over time. In contrast, mobile calls saw a significant increase in their volume, and by the end of the period, they had become the most common type of call.
In 1995, local fixed line calls accounted for over 70 billion minutes, which was significantly higher than the volume of national and international fixed line calls and mobile calls, both of which were under 20 billion minutes. However, over the next decade, the volume of local fixed line calls fell dramatically to just over 30 billion minutes, while the volume of mobile calls surged to nearly 60 billion minutes.
The volume of national and international fixed line calls remained relatively stable throughout the period, fluctuating around the 40 billion minute mark. By 2004, the total volume of these calls was slightly less than that of local fixed line calls, but still significantly lower than the volume of mobile calls.


