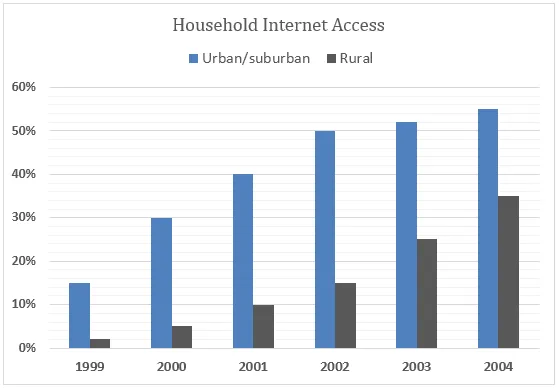
The line graph illustrates the proportion of households in both urban/suburban and rural areas of a European nation that had internet connectivity from 1999 to 2004.
At a glance, it is clear that internet access experienced a significant increase in all areas during this period, with urban/suburban households consistently having a higher percentage of connectivity. The gap between the two types of areas also seemed to widen over the years.
In 1999, less than 20% of urban/suburban households had internet access, but this figure rose sharply to just over 60% in 2002. Despite a slight dip in 2003, the percentage continued to climb, reaching nearly 80% by 2004. On the other hand, rural households began with a lower percentage of internet access, around 10% in 1999. This also saw a substantial increase, reaching approximately 50% in 2004. However, the growth was more gradual compared to urban/suburban areas.
In conclusion, while both urban/suburban and rural households showed a marked increase in internet access from 1999 to 2004, the former consistently outpaced the latter in terms of connectivity percentages. Furthermore, the gap between the two seemed to expand over the years, indicating a potential digital divide in this European country.


