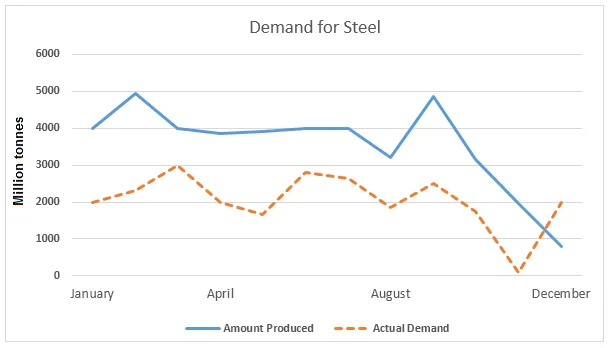
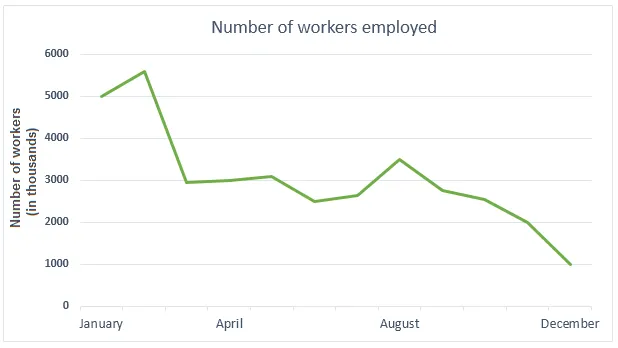
The line diagrams illustrate the quantity of steel produced and demanded, as well as the workforce size in the steel industry in the United Kingdom in 2010.
The most noticeable trend in the graphs is the fluctuation in steel production and demand, and the steady decline in the number of employees in the steel sector. The graphs also suggest a correlation between steel production and demand, and the number of workers employed in the industry.
In terms of steel production and demand, both started at around 12 million tonnes in January. They peaked at about 20 million tonnes in June, before falling to approximately 10 million tonnes in December. Interestingly, the demand always slightly exceeded the production throughout the year.
Regarding employment, the number of workers in the steel industry began at around 200,000 in January. Despite a slight increase to approximately 210,000 in June, the figure steadily decreased to just over 180,000 by the end of the year, indicating a general downward trend in employment in this sector.


