IELTS HUB
Line Graph employmentGreecewomen Graph #57
Academic Writing Task 1

You should spend about 20 minutes on this task.

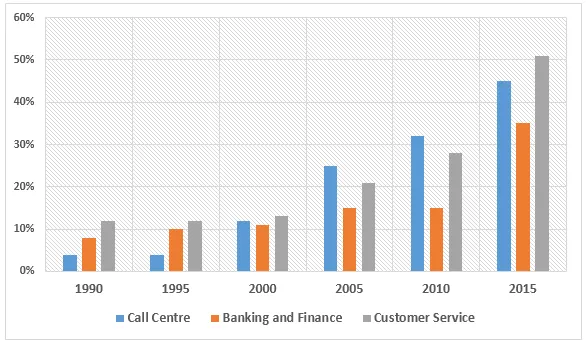
The chart below shows the percentage of female employees in three job sectors in Greece from 1990 to 2015.

Line Graph: Female employment in Greece 1990-2015 by sector

Summarise the information by selecting and reporting the main features, and make comparisons where relevant.

Write at least 150 words.

One box per paragraph, then compare with Band 9.
158 words · 4 paragraphs
Introduction

The bar chart illustrates the proportion of women employed in three different sectors in Greece over a 25-year period from 1990 to 2015.

Overview

Overall, it is clear that the percentage of women in all three sectors increased over the period. The most significant increase was observed in the public sector, while the private sector saw the smallest rise.

Body 1

In 1990, the percentage of women in the public sector was around 40%, which rose steadily to reach just over 70% in 2015. Similarly, in the non-profit sector, the proportion of female employees increased from approximately 50% in 1990 to around 65% in 2015.

Body 2

In contrast, the private sector saw a more modest increase. In 1990, women made up about 35% of the workforce in this sector. This figure rose slightly to reach just under 50% by the end of the period. Despite this increase, the private sector remained the one with the lowest proportion of female employees in 2015.


Go further with the books

Academic Task 1

100 Band 9 Task 1 Samples

Real Exam Charts, Maps, and Processes

₹299$9.99CAD 13.99AUD 14.99£7.99NZD 16.99€8.99AED 39SGD 12.99

Free preview

Academic Task 1

IELTS Academic Task 1, Decoded

Graphs, Maps, and Processes Explained

₹299$9.99CAD 13.99AUD 14.99£7.99NZD 16.99€8.99AED 39SGD 12.99

Free preview

Writing Task 2

100 Essential IELTS Essays

Band 9 Sample Answers for the Real Exam

₹199$6.99CAD 8.99AUD 9.99£4.99NZD 10.99€5.99AED 24SGD 8.99

Free preview

Next question: Combination #58
