IELTS HUB
Bar Graph ice creamUSAfood consumption Graph #70
Academic Writing Task 1

You should spend about 20 minutes on this task.

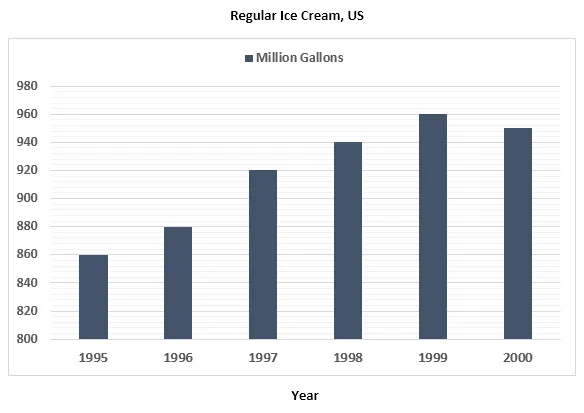
The column graph below shows the consumption of regular ice cream in the US market.

Bar Graph: Regular ice cream consumption in US market

Summarise the information by selecting and reporting the main features, and make comparisons where relevant.

Write at least 150 words.

One box per paragraph, then compare with Band 9.
175 words · 4 paragraphs
Introduction

The column chart illustrates the amount of regular ice cream consumed in the United States market over a period of five years.

Overview

At a glance, it is clear that the consumption of regular ice cream fluctuated during the given period, with a noticeable peak and a significant dip. Furthermore, it is evident that the consumption was not consistent throughout the years.

Body 1

Looking more closely at the data, in the first year, the consumption of regular ice cream was moderately high, but it saw a sharp increase in the second year, reaching its peak. This was followed by a significant decline in the third year, where the consumption was at its lowest point.

Body 2

In the final two years, there was a gradual recovery in the consumption of regular ice cream. The fourth year saw a moderate increase, while the fifth year witnessed a more substantial rise, though it did not reach the peak level of the second year. Despite these fluctuations, the overall trend indicates a general preference for regular ice cream in the US market.


Go further with the books

Academic Task 1

100 Band 9 Task 1 Samples

Real Exam Charts, Maps, and Processes

₹299$9.99CAD 13.99AUD 14.99£7.99NZD 16.99€8.99AED 39SGD 12.99

Free preview

Academic Task 1

IELTS Academic Task 1, Decoded

Graphs, Maps, and Processes Explained

₹299$9.99CAD 13.99AUD 14.99£7.99NZD 16.99€8.99AED 39SGD 12.99

Free preview

Vocabulary

Upgrade Your English

1,800 Sentences from Band 5 to Band 9

₹299$9.99CAD 13.99AUD 14.99£7.99NZD 16.99€8.99AED 39SGD 12.99

Free preview

Next question: Bar Graph #71
