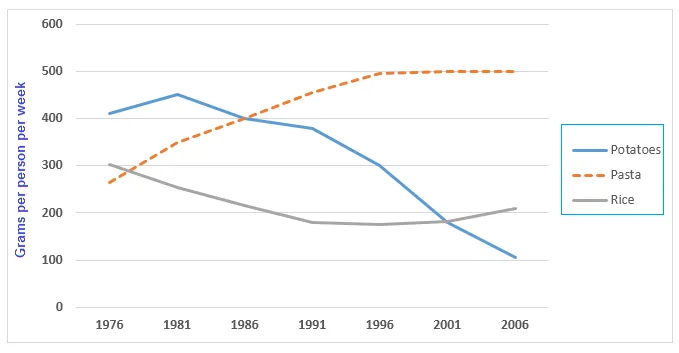
The line graph illustrates the consumption of three different types of food, namely potatoes, pasta, and rice, measured in grams, in a particular European nation over a 30-year period from 1976 to 2006.
It is clear from the graph that while the intake of potatoes and pasta experienced a decline, the consumption of rice saw an upward trend during this period. Additionally, potatoes were the most consumed food item at the beginning of the period, but by the end, rice had taken over this position.
In 1976, the consumption of potatoes was the highest, standing at around 350 grams, which gradually decreased to just over 200 grams by 2006. Simultaneously, pasta, which initially was consumed at approximately 150 grams, saw a sharp fall in the late 1980s and continued to decrease, reaching its lowest point at around 50 grams in 2006.
On the contrary, the consumption of rice showed a steady increase throughout the period. Starting at about 50 grams in 1976, it rose to around 100 grams in the mid-1990s and finally surpassed the consumption of potatoes and pasta to reach approximately 250 grams by 2006.


