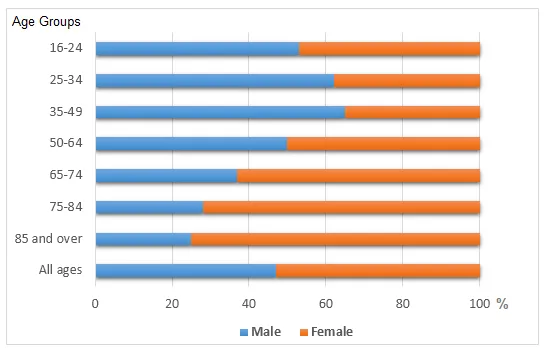

The bar chart illustrates the percentages of English males and females across various age groups who lived alone in 2011, while the pie chart provides a comparison of the number of bedrooms in these single-occupancy homes.
The bar chart reveals a clear trend of increasing solitary living with age for both sexes, while the pie chart shows that one-bedroom homes were the most common type of accommodation for individuals living alone. However, there are some noticeable differences in the distribution of the number of bedrooms.
In terms of age, for those aged 45-54, the proportion of men living alone was slightly higher than women, at approximately 9% compared to 7%. This pattern was reversed in the 65-74 age group, where around 12% of women lived alone, compared to just under 10% of men.
Regarding the number of bedrooms, one-bedroom homes accounted for nearly half of all one-person households. Two-bedroom and three-bedroom homes made up approximately 30% and 15% respectively, while homes with four or more bedrooms were the least common, representing just 10% of the total.


