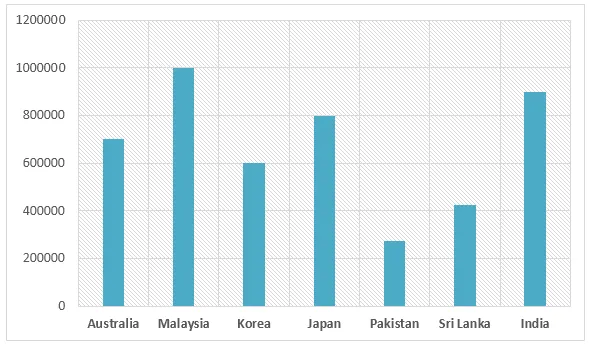
The line graph provides information about the holiday destinations chosen by tourists from a specific Asian nation in the year 2012.
At a glance, it can be observed that there were significant fluctuations in the number of tourists visiting various destinations, with one particular location experiencing a dramatic increase in popularity. The destinations varied in terms of their appeal to the tourists, with some maintaining a steady flow of visitors throughout the year, while others experienced peaks and troughs.
Looking at the details, the most popular destination experienced a steady increase in the number of visitors from January to June, peaking at about 8000 in June. After this point, the numbers gradually declined, reaching their lowest point in December. This destination was consistently more popular than the others throughout the year.
In contrast, the least popular destination had a relatively stable number of visitors, with minor fluctuations throughout the year. The other two destinations experienced significant peaks and troughs, with one peaking in the summer months and the other in the winter, indicating a seasonal preference among the tourists.


