IELTS HUB
Bar Graph televisionsalesglobal market Graph #93
Academic Writing Task 1

You should spend about 20 minutes on this task.

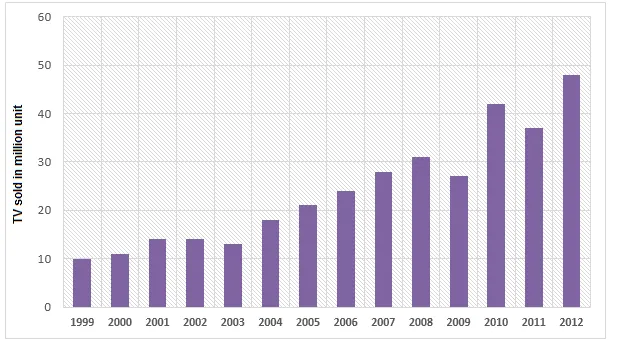
The bar chart below shows the global sales of televisions by Supervision Incorporation from 1999 to 2012.

Bar Graph: Global television sales by Supervision Inc 1999-2012

Summarise the information by selecting and reporting the main features, and make comparisons where relevant.

Write at least 150 words.

One box per paragraph, then compare with Band 9.
164 words · 4 paragraphs
Introduction

The bar chart illustrates the worldwide sales of televisions by Supervision Incorporation over a 14-year period from 1999 to 2012.

Overview

At a glance, it is apparent that there was a significant fluctuation in the sales of televisions during the given period. Moreover, a general trend of increase can be observed, despite a few dips in certain years.

Body 1

In 1999, sales started at just over 1 million units, with a steady rise reaching a peak of approximately 3 million units in 2003. However, a sharp decline was witnessed in the following two years, reaching a low of around 1.5 million units in 2005. This was followed by a period of steady growth until 2008, when sales once again plummeted.

Body 2

From 2009 onwards, a rapid increase in sales was observed, peaking at nearly 5 million units in 2012. Despite the occasional drops, the overall trend over the 14-year period was an upward trajectory, with sales in 2012 being almost five times higher than in 1999.


Go further with the books

Academic Task 1

100 Band 9 Task 1 Samples

Real Exam Charts, Maps, and Processes

₹299$9.99CAD 13.99AUD 14.99£7.99NZD 16.99€8.99AED 39SGD 12.99

Free preview

Academic Task 1

IELTS Academic Task 1, Decoded

Graphs, Maps, and Processes Explained

₹299$9.99CAD 13.99AUD 14.99£7.99NZD 16.99€8.99AED 39SGD 12.99

Free preview

Vocabulary

Upgrade Your English

1,800 Sentences from Band 5 to Band 9

₹299$9.99CAD 13.99AUD 14.99£7.99NZD 16.99€8.99AED 39SGD 12.99

Free preview

Next question: Line Graph #94
